2020 Property searches up 52% YOY – March 2021
13 Mar 2021|5 MIN READ
We've seen how search behaviour has changed throughout retail during Lockdown. But how much has changed in the landscape of Real estate in the UK and property SEO?
I looked at Pi’s dataset in the property market and asked two property experts, Ben Kelly and Ben Gannon Directors of Lanbury Group to give their perspective on this changing landscape.
The Background: Did the Stamp Duty holiday have an affect on the property search market?
Prior to lockdown, the property market had seen house prices fall for four months in a row. But the stamp duty holiday has since been credited with fuelling a mini-boom in the market. According to recent governmental figures, more than 100,000 residential properties were bought and sold in October making it the busiest October for over ten years.
“With the view of aiding the property market after the first lockdown of 2020 The Government introduced a stamp duty holiday in England and Northern Ireland. It in effect meant that all properties below £500,000 paid no stamp duty, and those above paid £15,000 less on their duty.” – Ben Kelly, Lanbury Group
Growth in Property Searches 2020 Google UK – SEO
At Pi we have been tracking a data-set around the property market for several years. We track individual terms and then categorise them into separate groups of: Auction, Domestic Buying, Estate Agents, For sale, Homes and Houses, Property.
Notes on the Data:
The search term groups used is certainly not exhaustive, indeed there will be many more searches than this with a larger dataset. But this dataset gives a good indication of the trends in the market and the increase in demand, as well as the Share of search across the entire landscape. (Pi is the only SEO Platform that looks at the entire landscape for Share of Voice and Share of search).
Demo the software
Book your demoProperty searches up 52% YOY June 2019-2020
The Summer time is obviously a primetime to sell a property with greater interest during that period. 2020 was particularly warm, but the post lockdown boost and the stamp duty holiday meant that June-August saw a significant rise of searches.
In the chart below we see the sharp rise in property searches across all categories, and within the sub categories.
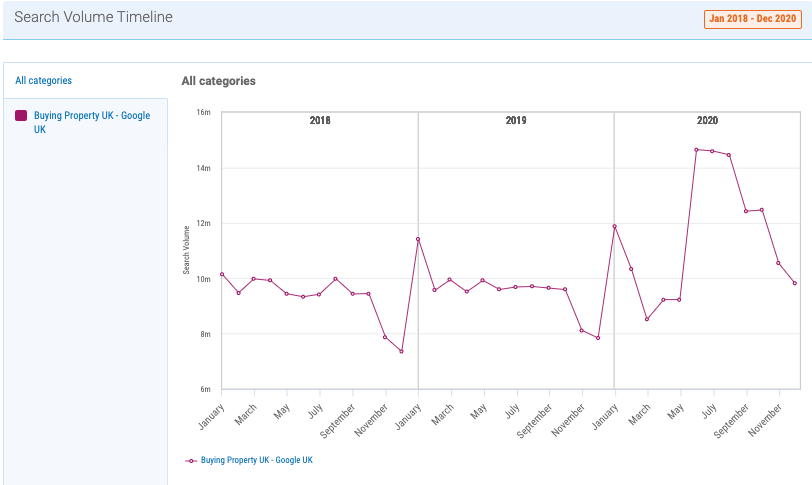
Image source: Pi Market Intelligence
Across all categories we see a rise of 52% from June 2019 to June 2021.
For the Sub category of “For sales” this is a similar figure of 52% growth.
Growth in “For Sale” category of UK property market 2019-2020
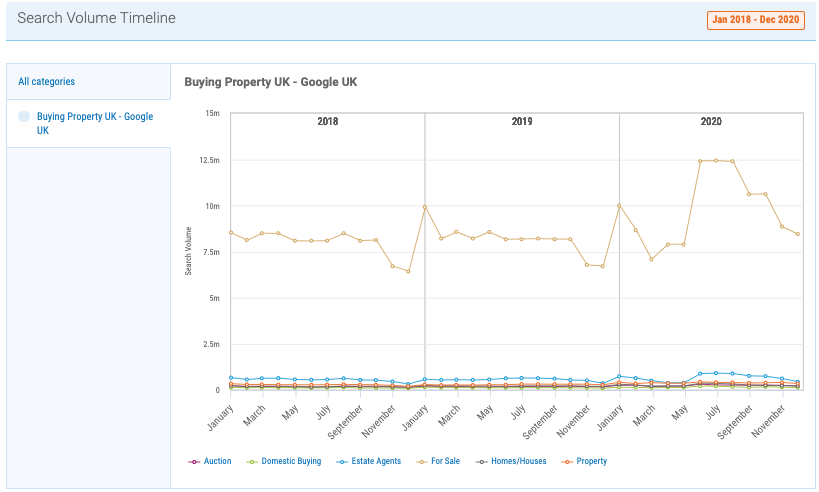
Image source: Pi Market Intelligence
A similar rise of around 50% was seen across all the subcategories, including “Estate Agents” who were seemingly busy throughout the summer as they tried to work around the lockdown and social distancing restrictions.
“We quickly saw that Estate Agents who had the ability to offer virtual viewings in early and then later summer of 2020 were able to realise far more transactions than those that solely relied on house visits. During that period there were significant changes to social distancing rules which obviously meant fewer personal viewings, but also when the restrictions were lifted people still had concerns about coronavirus.” – Ben Kelly, Lanbury Group.
When we take out the “For sale” category, we can clearly see the growth across the other categories – most notably “Estate agents”. Which indicates clear search intent on wanting to view properties, either virtually or in person.
Growth in all categories including Estate Agents – UK property market 2019-2020
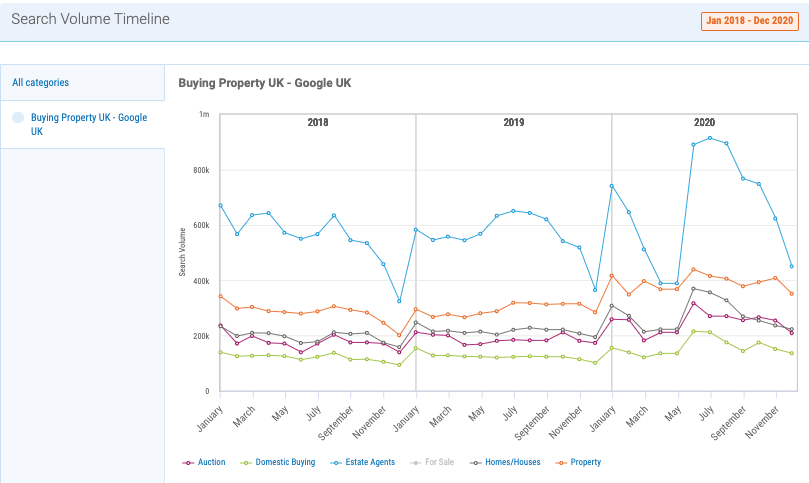
Image source: Pi Market Intelligence
Even-though we see a seasonal dip later in the year, November and December searches were still over 25% up from the previous year, showing that the stamp duty holiday had an impact. Or it could simply be down to the fact that we’ve been at home with nothing else todo.
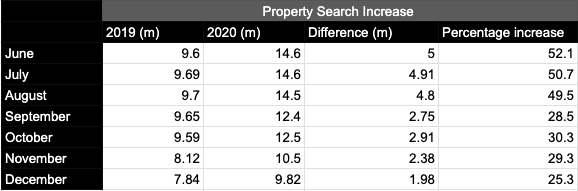
Month on Month Growth UK Property Searches
(Pi Property dataset only. View increases rather than totals. Total searches will be far greater than this with a larger data-set)
Who has the Largest Share of Voice in the UK Property Market for search?
Below we see the Pi Share of Voice chart. With Pi you don’t need to track individual domains, this is the whole landscape based on the terms in the dataset across the relevant categories.
UK Property Organic Share of Voice March 2021
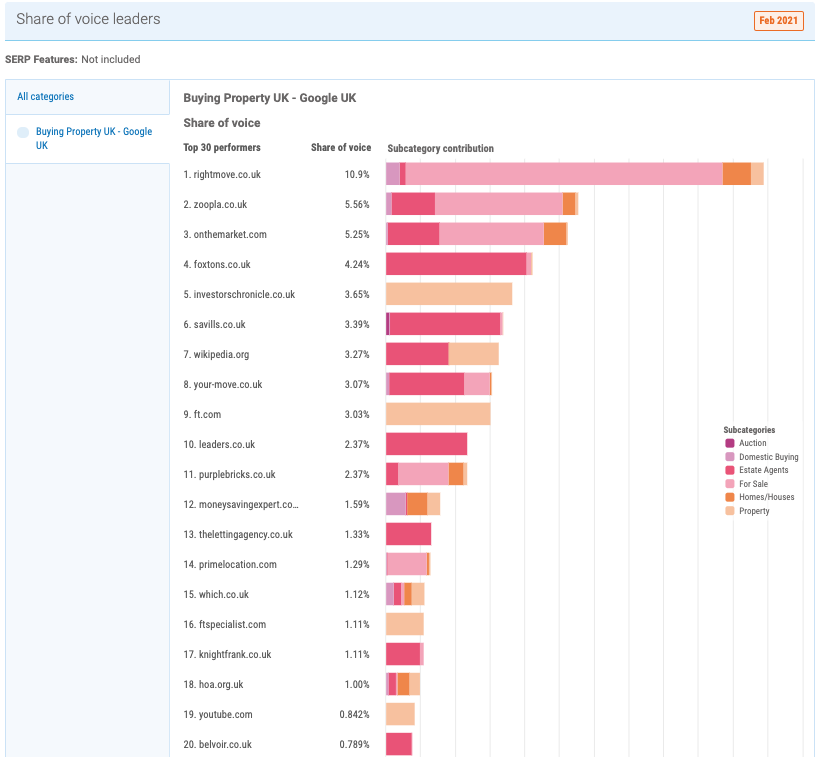
Image source: Pi Market Intelligence
In this chart we see that Rightmove, the online property search engine has almost double the Share of Voice of direct competitors Zoopla in second place. It’s a significant lead in a market that’s seen substantial growth. But can they hold onto it?
The rest of the landscape is made up of leading national estate agents, which is probably expected, such as Foxtons, Savills, Leaders. However publishers such as the FT and Which are also present. Interestingly YouTube is in 19th spot for the Share of Voice.
“YouTube has seen a significant increase in content from established Estate Agents and independent sellers, this has been growing over the last few years but boomed during lockdown. Views of property are astronomical compared with simple website views, let alone actual in-person views. It’s an excellent way for the local estate agent to get their property seen and increase their lead book.” – Ben Gannon, Lanbury Group.
Even ordinary properties are be viewed 1000s of times in just a few months.

Share of Voice timeline – Property Market UK March 2021
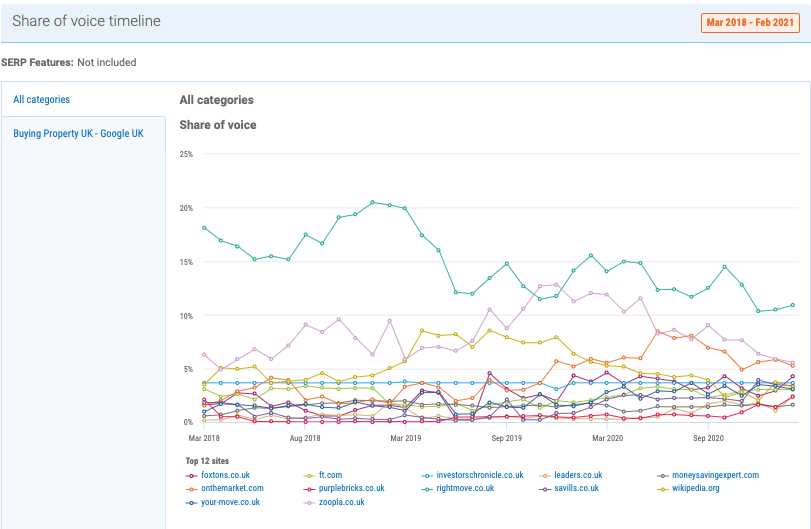
Image source: Pi Market Intelligence
However, when we look at the share of voice timeline, we can see that Rightmove is being pegged back. This isn’t necessarily down to Rightmove losing position, but more to do with the fact that the “Estate Agent” market has grown over the period. Behaviours have changed recently, and Rightmove don’t have such dominance for those searches when it comes to direct viewings.
Demo the software
The Opportunity for Rightmove
In the Pi opportunity chart below, the blue colour shows what Rightmove are performing for. The Red shows page two performance – this is almost the entirety of the “estate Agent” category.
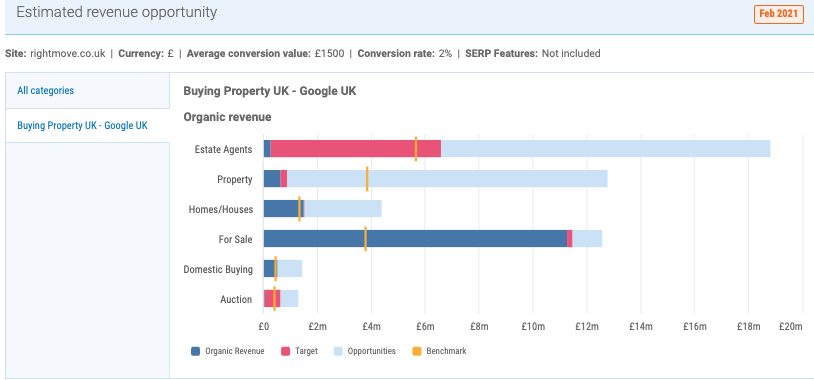
Image source: Pi Market Intelligence
The Stamp Duty holiday is set to continue to June 2021. As Spring comes searches will start to increase again. Lockdown and search behaviour has changed in the property market, as we demand more virtual views or quick fast-food type views on YouTube.
“The estate agents and large property websites need to adapt to this changing behaviour, or we will see a whole new generation of savvy independent sellers take control of their local and possible national markets.” – Ben Kelly-Gannon, Lanbury Group
Demo the software


Never miss a post
Join our mailing list and have our SEO news delivered straight to your inbox.