Product Update: Introducing seven new performance and opportunity features
07 Nov 2022|5 MIN READ
Seamless workflows from insights to implementation just got a whole lot easier with Pi’s new performance and opportunity features.
This month we’ve transitioned Market Intelligence components into platform tools which enables you to jump straight into our explorer tools from MI data.
This will help you uncover new high-value opportunities straight away and then enable a workflow that lets you execute against this opportunity.
These new journeys not only allow you to view important insights in an instant, but they’ll also keep you focused on the metrics that matter most to your stakeholders; identifying commercial opportunities (and risks) and highlighting new areas of growth that will drive the biggest commercial gains.
To do so, we’ve added SoV, estimated traffic, and estimated revenue to the SEO Keyword Rank Tracking tool
To access these new platform tools, make sure you’ve switched to the new navigation in the app.
Right, let’s dive right in…
Performance > Traffic and Revenue > Estimated Revenue Performance
Using your average conversion value combined with average conversion rate, use Pi to track your estimated revenue performance.
View the estimated organic revenue your site is driving for different categories – essential when it comes to exploring where there’s opportunity for more, but also where you might be seeing some of the biggest commercial falls too.
And even better, you can also set this up to keep track of how you’re performing versus your competitors too.
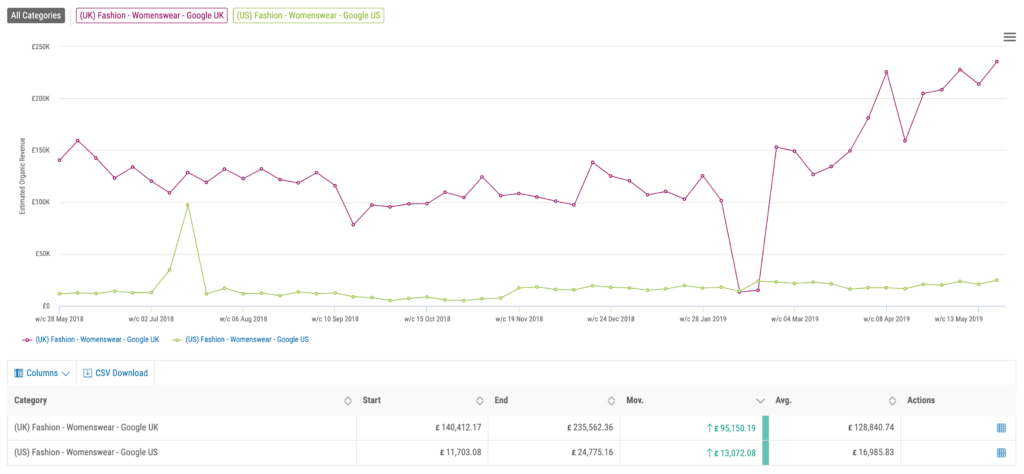
Pi Datametrics | SEO ROI: Estimated Revenue Performance chart
Now you can also sort your estimated revenue by search terms via the Position Explorer Table. Again, allowing you to prioritise terms with the highest value opportunities. But, you’ll also be able to identify which terms are losing value too and where to focus your efforts for some quick returns.
In the Position Explorer Table add filters to refine your query or view more in depth data. For example, you could view which terms have gone down with a search volume of 100+ which will help you prioritise your next steps.

Pi Datametrics | Rank Tracking: Position Explorer Table
Performance > Traffic and Revenue > Estimated Traffic Performance
Focusing on your estimated traffic performance, this feature allows you to see how your organic traffic peaks on declines over a certain time period. You’ll also have the ability to view the estimated traffic performance for any competitors that you have set up an MI for.
Same as Estimated Revenue Performance, you’ll now be able to go straight into Position Explorer Table to see your estimated traffic by search terms – allowing you to quickly put a strategy in place that will meet your organic traffic KPIs and goals.
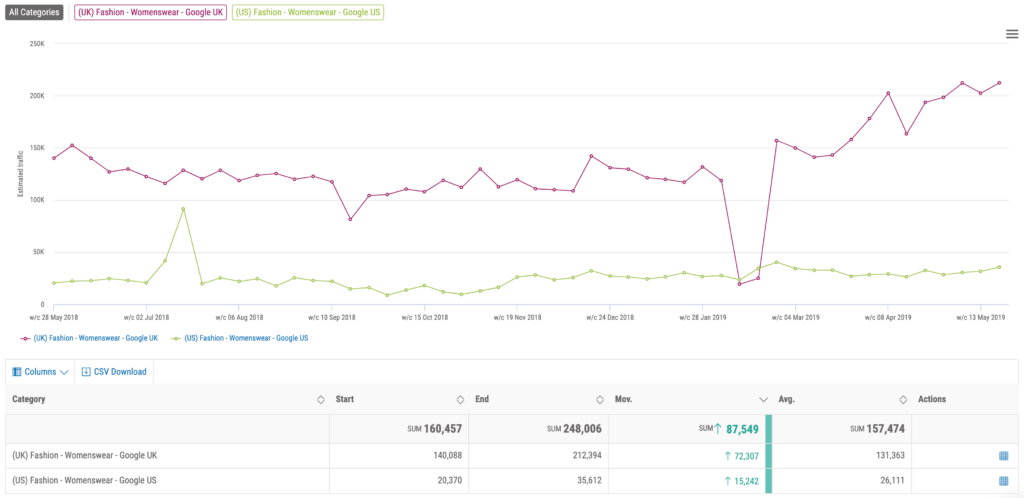
Pi Datametrics | SEO ROI: Estimated Traffic Performance chart
Performance > Competitor Benchmarking > Share of Voice Leaders
Under Competitor Benchmarking you can now easily view the share of voice market leaders in your sector.
Use Pi’s Share of Voice Tools to keep score of how you’re performing organically compared to your biggest competitors and use this insight to inform your SEO strategy.
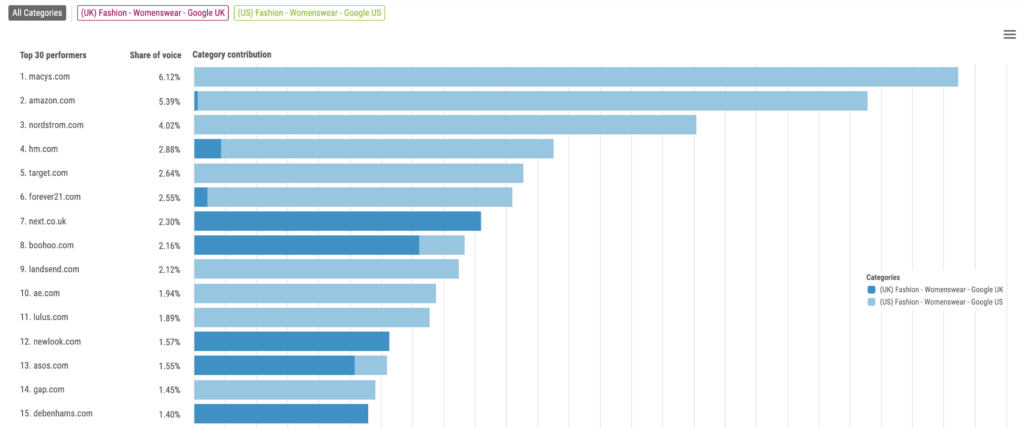
Pi Datametrics | Share of Voice Tool
Performance, Competitor Benchmarking: Share of Voice Leaders – Over Time
View your wins and losses with our Share of Voice Leaders – Over time. See how your share of voice changes over a certain time period and in comparison to your biggest competitors to help inform your seasonal SEO strategies.
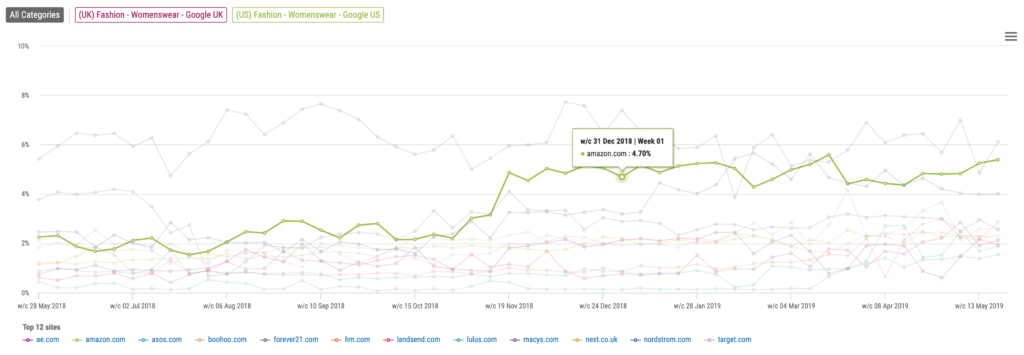
Pi Datametrics | Share of Voice Leaders – Over Time
Using Share of Voice Leader tools you can sort by average SoV or by movement to see how you stand against your true competitors. Understand those that have made the biggest gains and what they’re doing well and compare this to your own strategies and efforts.
Opportunity > Search Volume Timeline
Use our Search Volume Timeline to see search volume by month over time.
Quickly see year-on-year search theme trends, peaks and declines in demand and importantly, the themes with the greatest commercial opportunity.
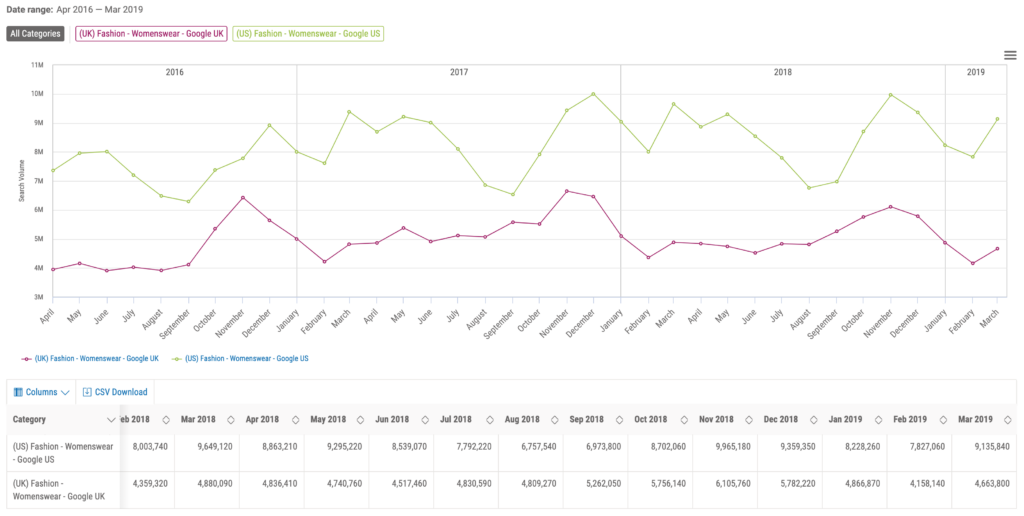
Pi Datametrics | Search Volume Timeline
Opportunity > Estimated Revenue Opportunity
Highlight the additional revenue you could be getting if you were in positions 1 to 10, use Pi’s Organic ROI Software, Estimated Revenue Opportunity to help focus your efforts on the terms where you will receive the highest gains straight away.
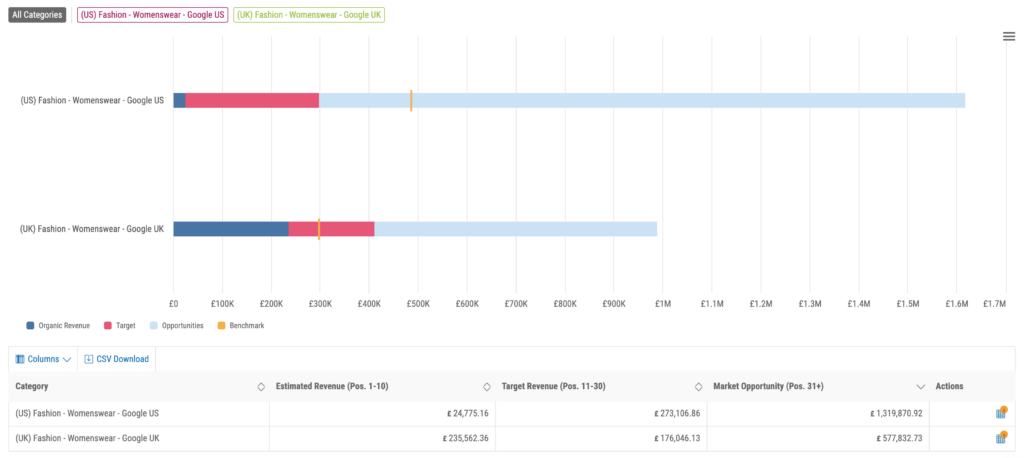
Pi Datametrics | Estimated Revenue Opportunity
In this latest product release you can now click straight through to our Position Explorer Table where your terms will be ordered by estimated revenue allowing you to see where to focus your efforts for the best commercial gain.
Use the Position Explorer Table’s filters to refine the data and your search terms to explore by search volume and estimated revenue.
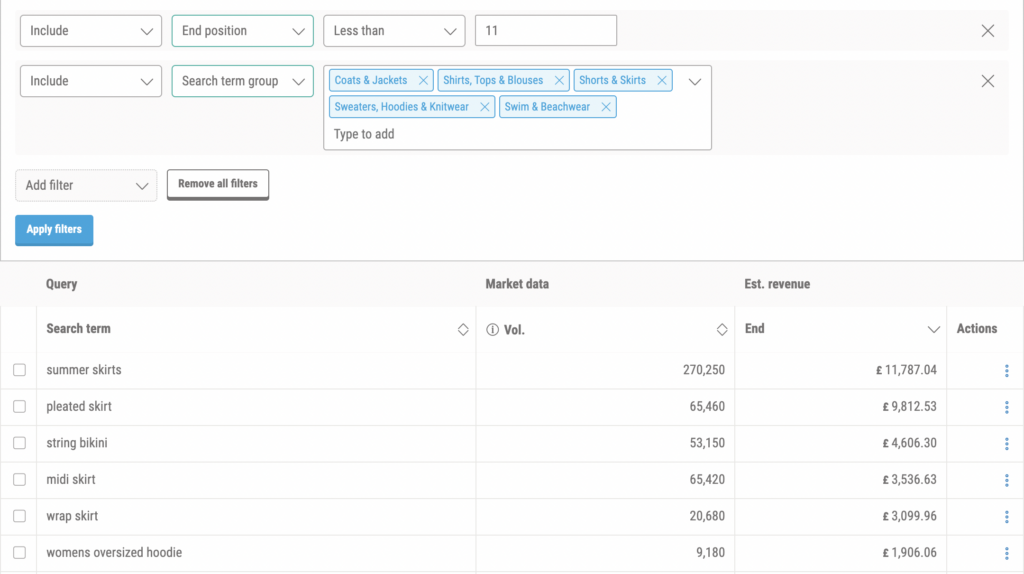
Pi Datametrics | Position Explorer Table – Estimated Revenue Opportunity
Opportunity > Historic Revenue Potential
With our Historic Revenue Potential timeline you can view revenue potential by month over time.
Utilise this data to understand the peaks and declines in revenue opportunity and identify which search theme trends will generate the most commercial value throughout the year.
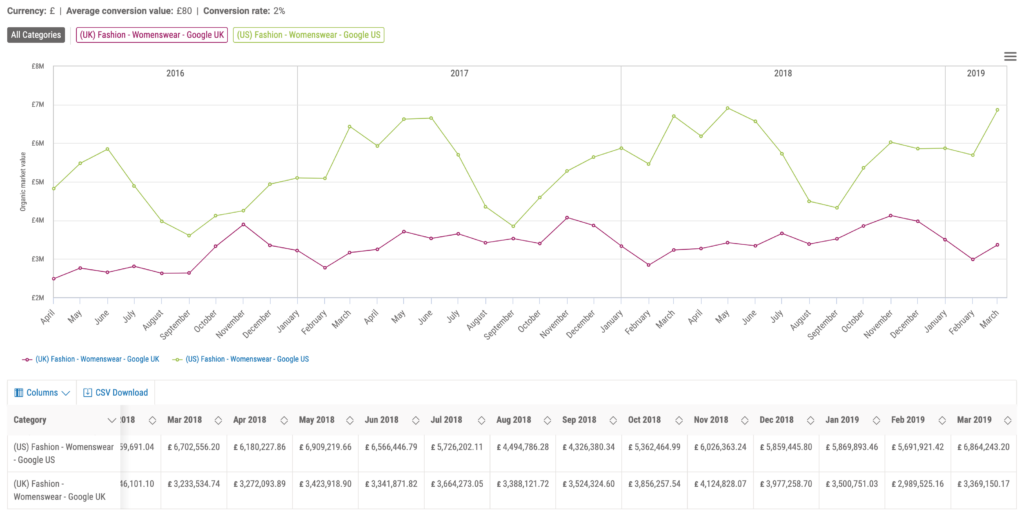
Pi Datametrics | Historic Revenue Potential
Use the table of data to quickly highlight certain months of the year that have had the potential to deliver higher revenue opportunities. This will help you plan your SEO strategy in relation to seasonal trends and know when it’s important to add additional value.
Already a Pi customer? Jump straight in and explore your new tools now (if you haven’t already, just make sure you’ve switched over to the new navigation to access them). Sign in here.
Interested in finding out more about the Pi Platform? Book your demo below!
Demo the software
Book your demoNever miss a post
Join our mailing list and have our SEO news delivered straight to your inbox.
