Pi Product updates: three new features for 2021 to improve search performance
By Graham Charlton|26 Jan 2021|5 min read
We’ve been busy adding new features to help make data discovery easier for users of the Pi's SEO platform, to help you to extract more value from our insights, and to do so more efficiently.
There are three new features to tell you about today, all designed to make data easier to find, and improve your ability to share insights within your company, and to understand the latest changes in the SERP landscape.
Market intelligence reporting components
We’re keen to promote collaboration within companies, and the ability to share and act upon insights gained from the platform.
Until now this hasn’t been as easy as it could be with our Market Intelligence (MI) views, so we’ve brought MI components into our SEO reporting suite.
Here’s how it works. Within our reports section, simply create a new report. In this example we’ll use standard configurations to keep it simple, choosing a weekly report with the default time period.
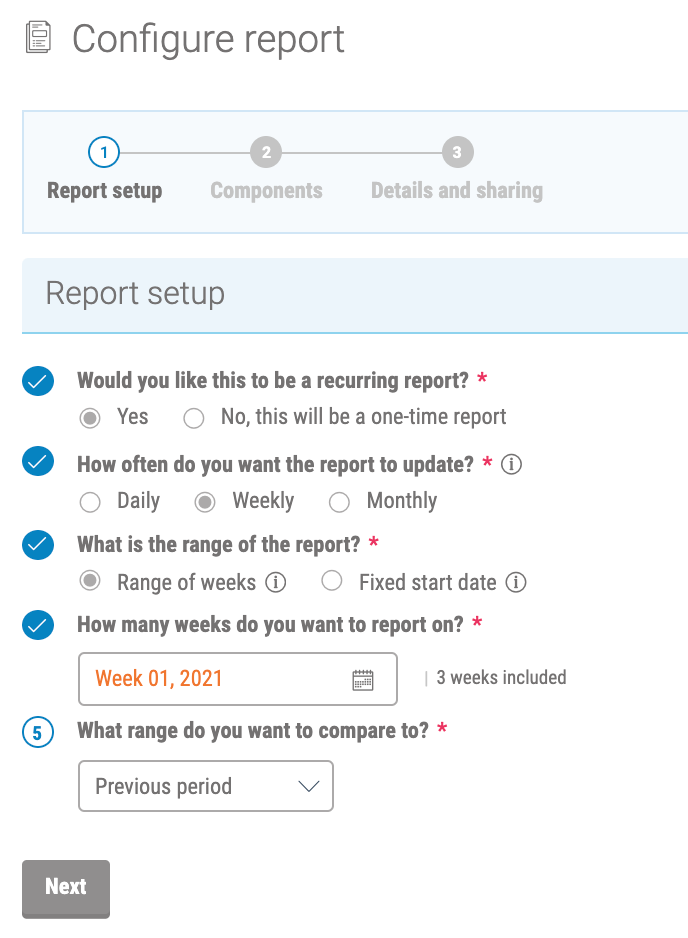
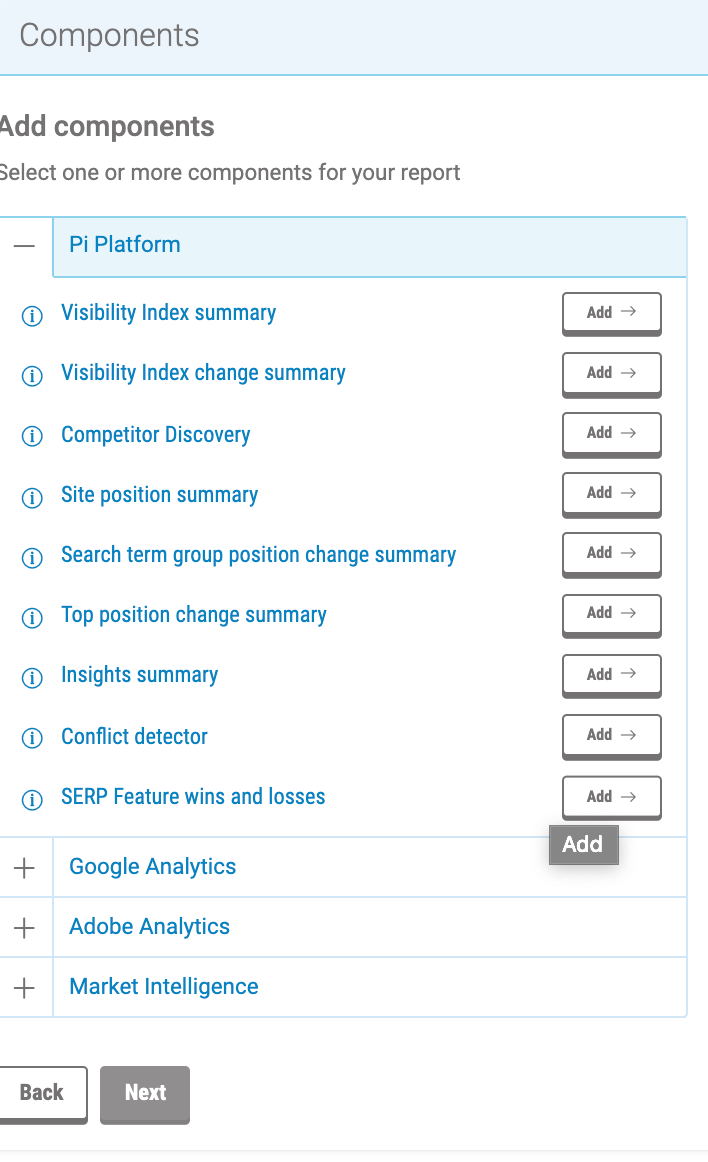
Once you’ve selected this, you can see the standard report configuration page. This shows the usual PI platform modules plus Google Analytics and Adobe Analytics, and now we have Market Intelligence.
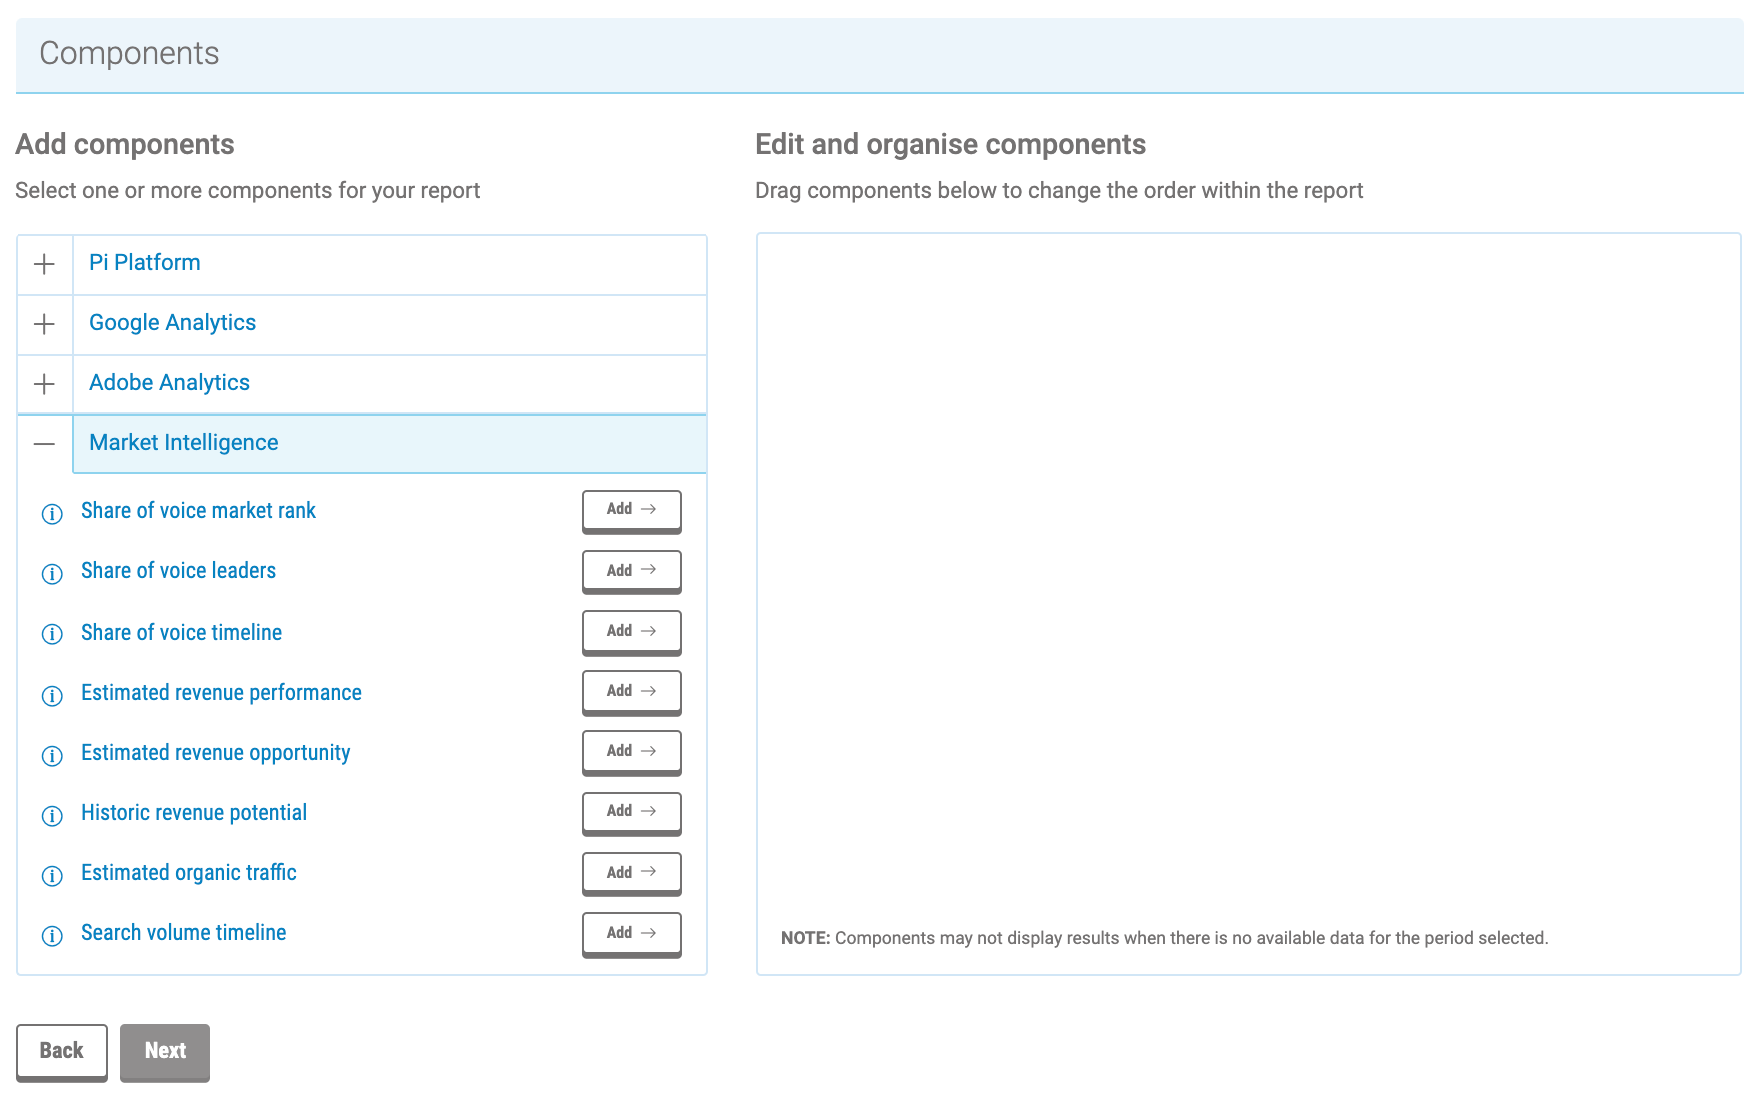
By clicking the Market Intelligence segment, you can view the eight modules you can use as part of standard reports. You can use one or two of them, all of them, or mix and match with other reporting components. It’s as easy as that.
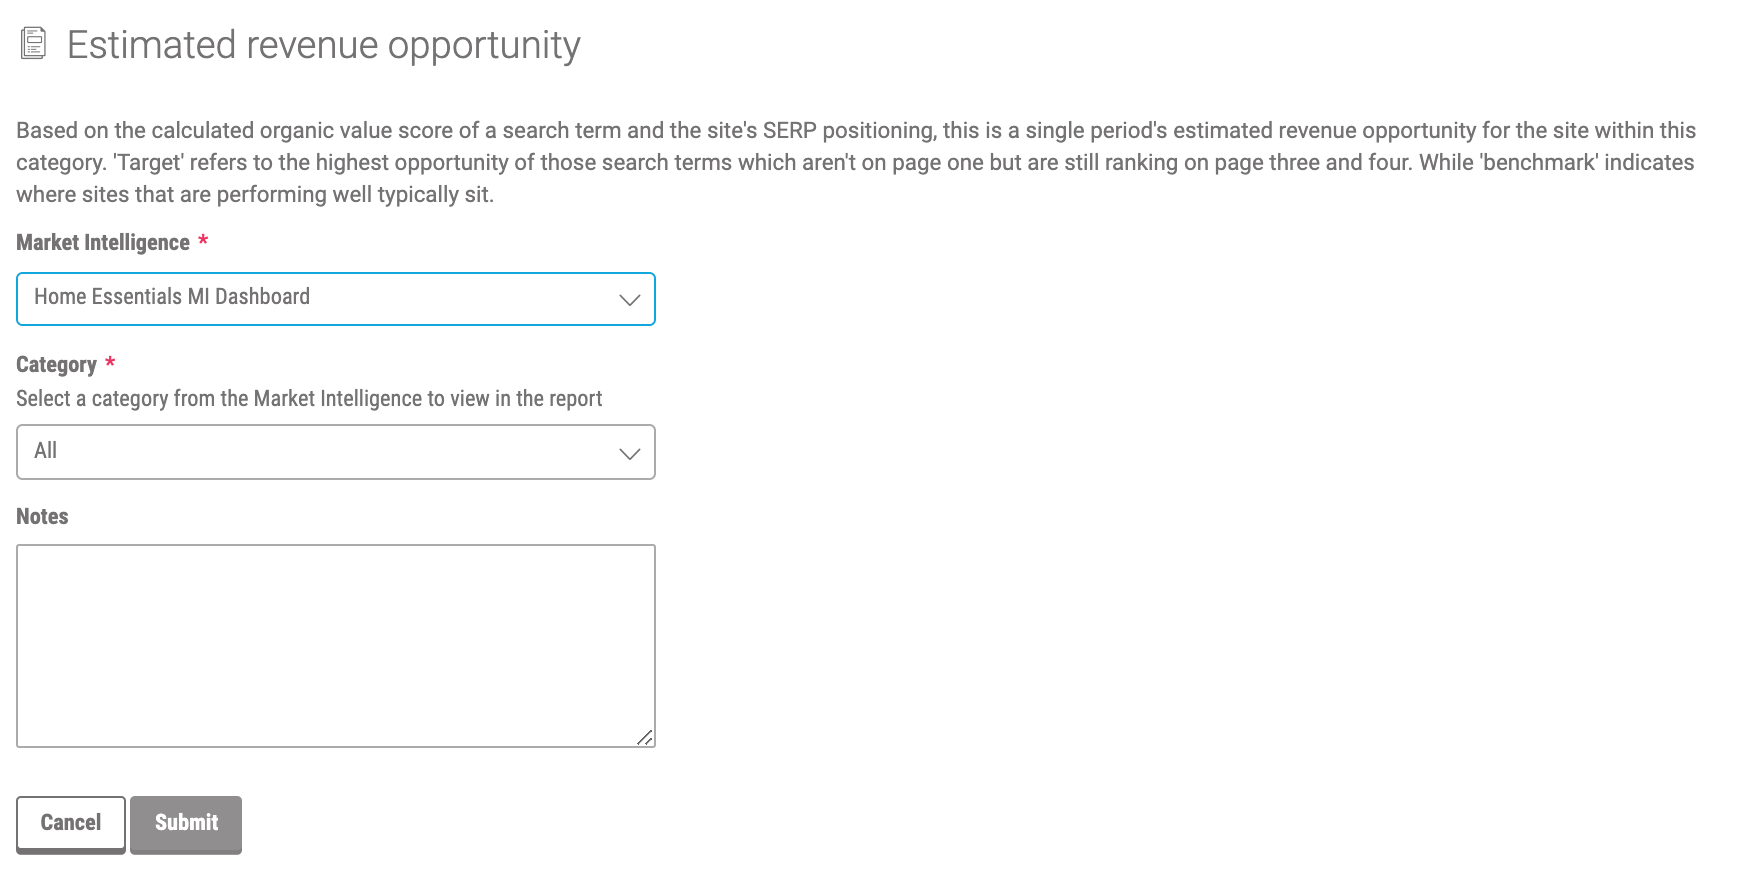
Here, we’ll choose a revenue opportunity, an MI report that I want that revenue opportunity then from, then a category and press submit. This module will then be part of your report.
Once that’s done and you’ve chosen all the MI modules you want, you can add others. For example, you can add an insights summary, which can tell you about your content that currently sits on pages two and three and has the potential to rank higher.
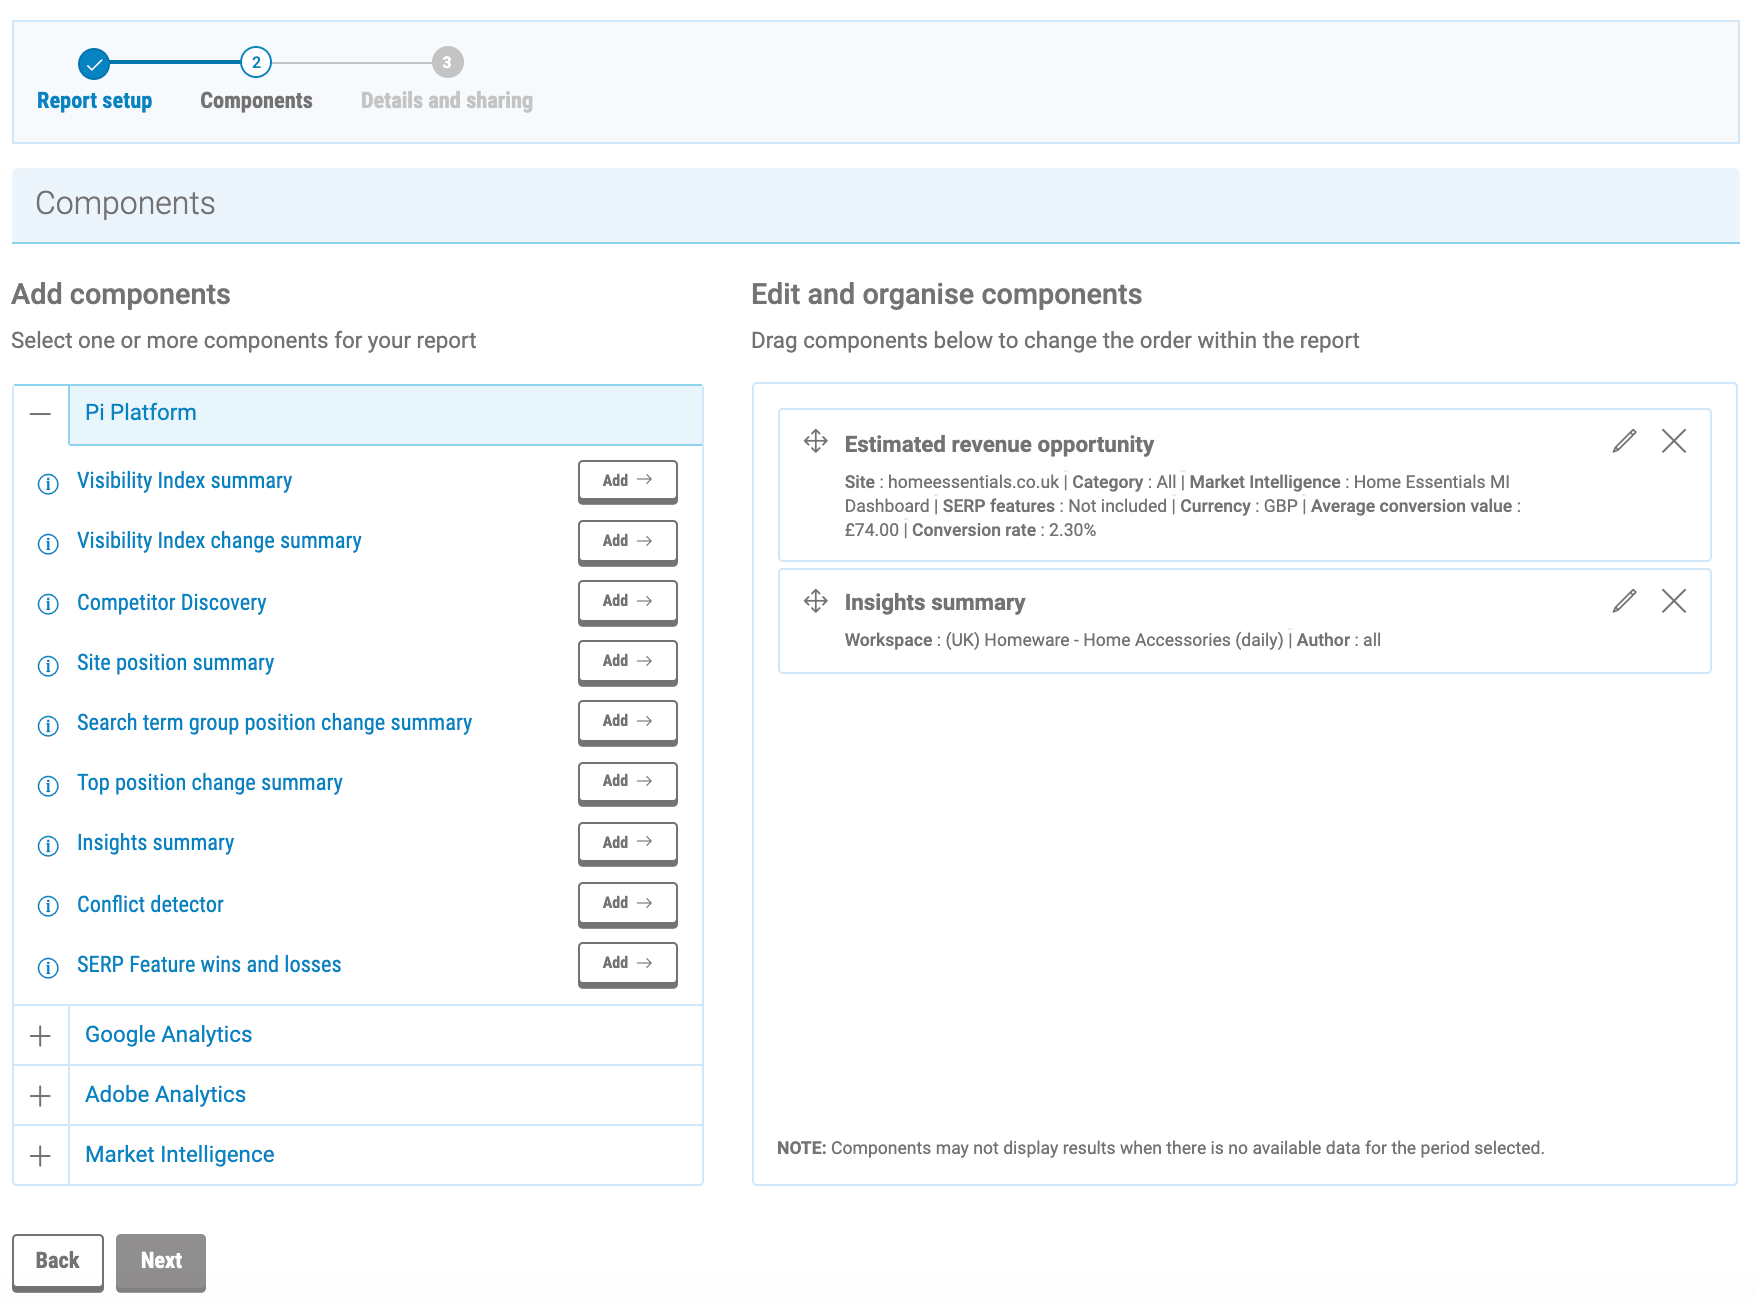
Once you’ve added the components you want in your report, simply click next, choose a title, and you’re done. This report can then be automatically generated and delivered to you and all of your subscriber inboxes every Monday with the latest data.
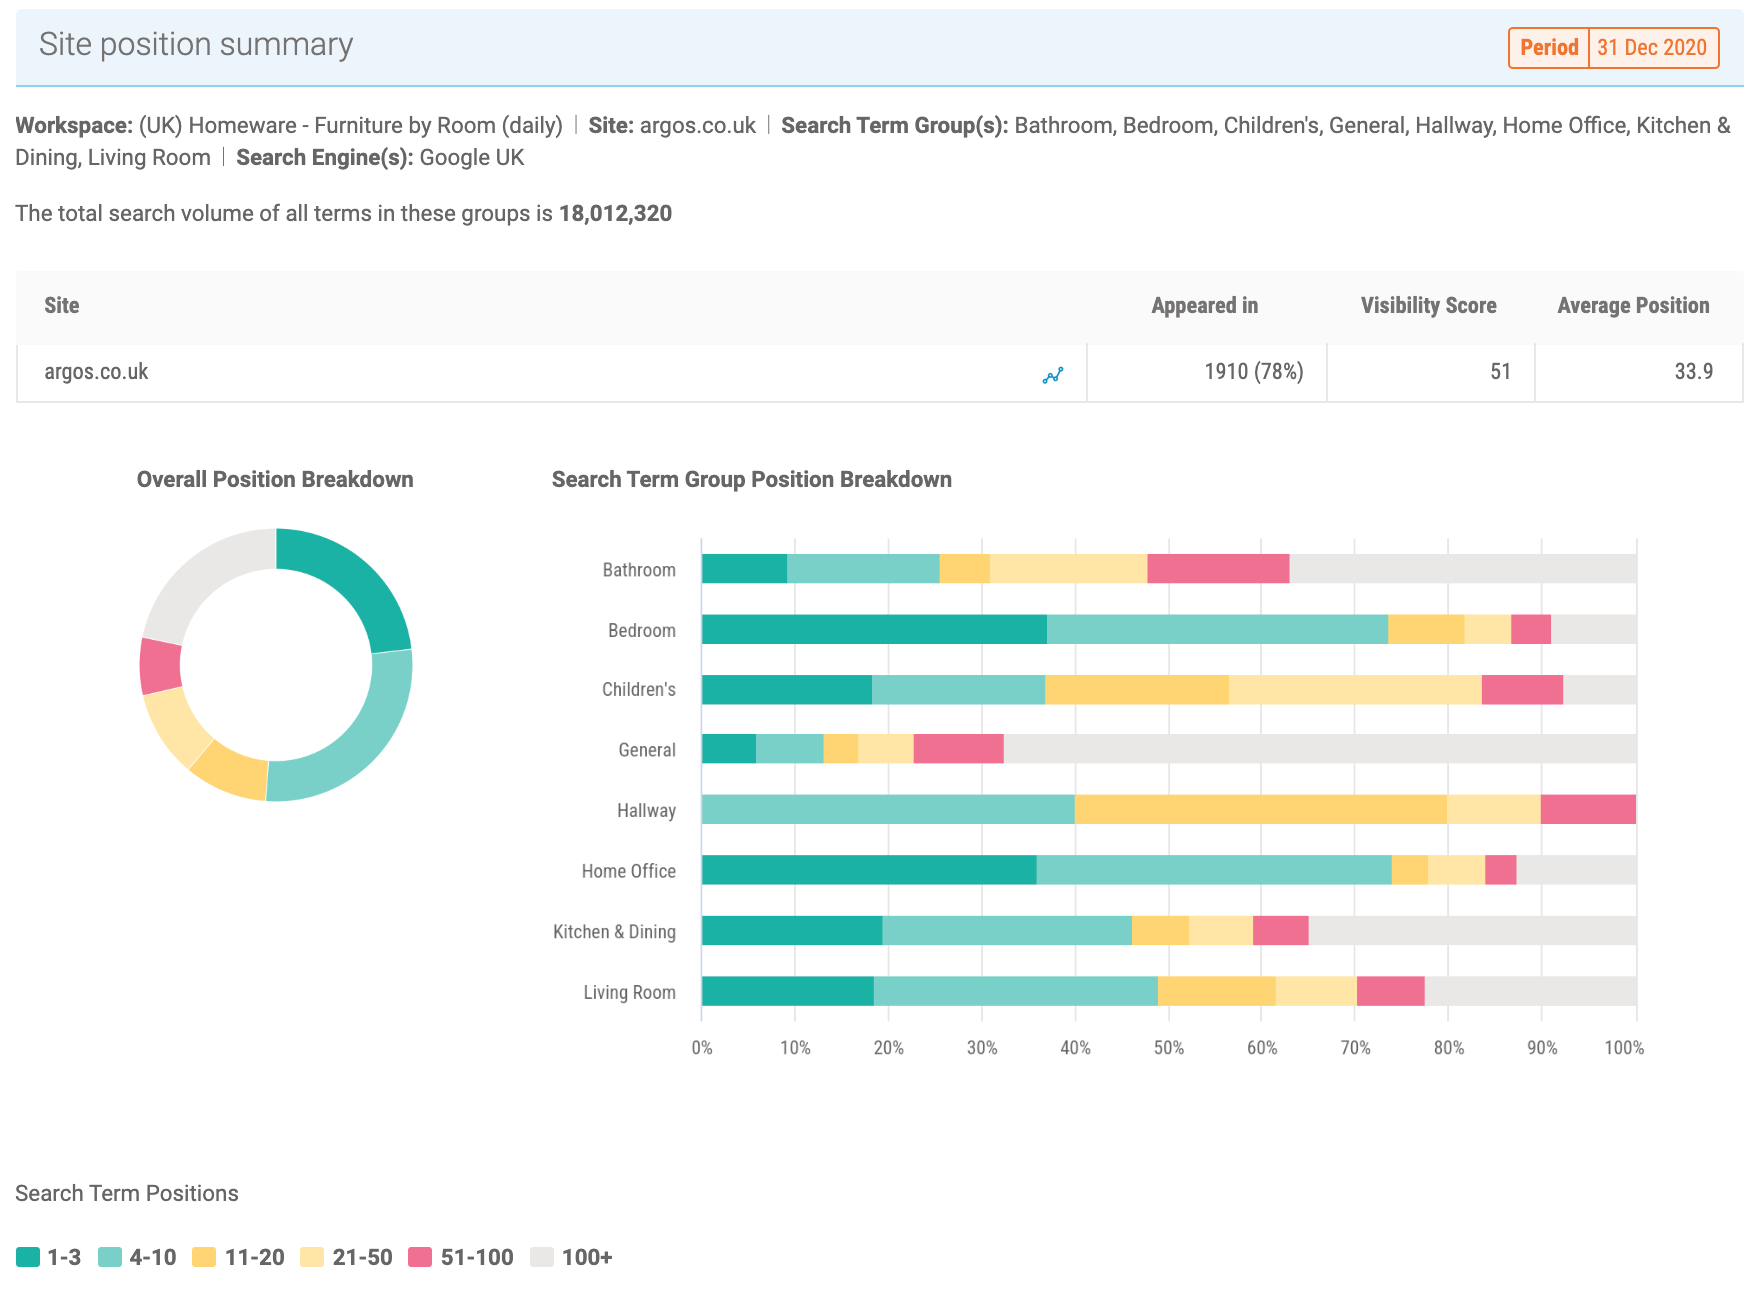
Here’s a finished report. This begins with a site position summary:
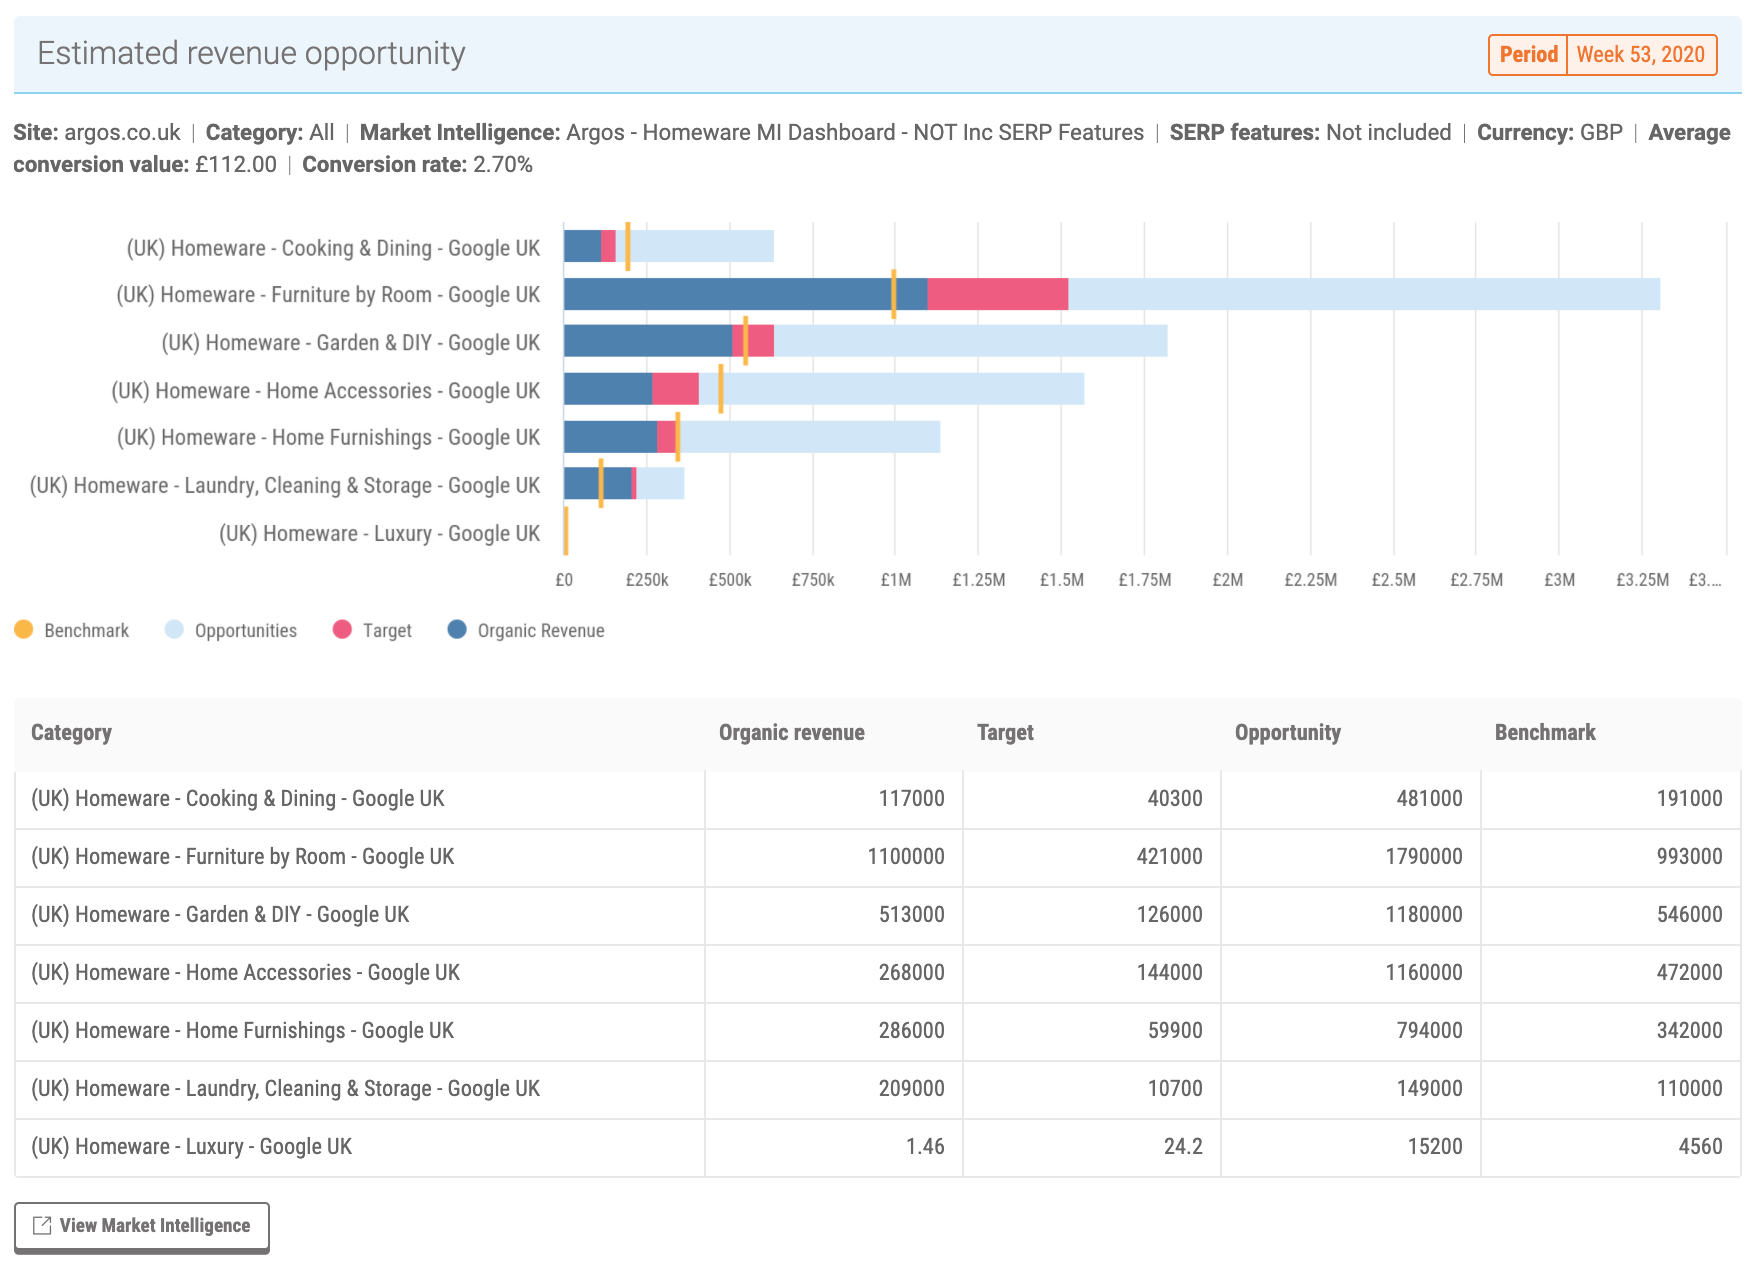
It then moves into the estimated revenue SEO ROI Software data.
Setting up and configuring eight modules in a report can be time consuming so we’ve added a useful shortcut to speed up this process.
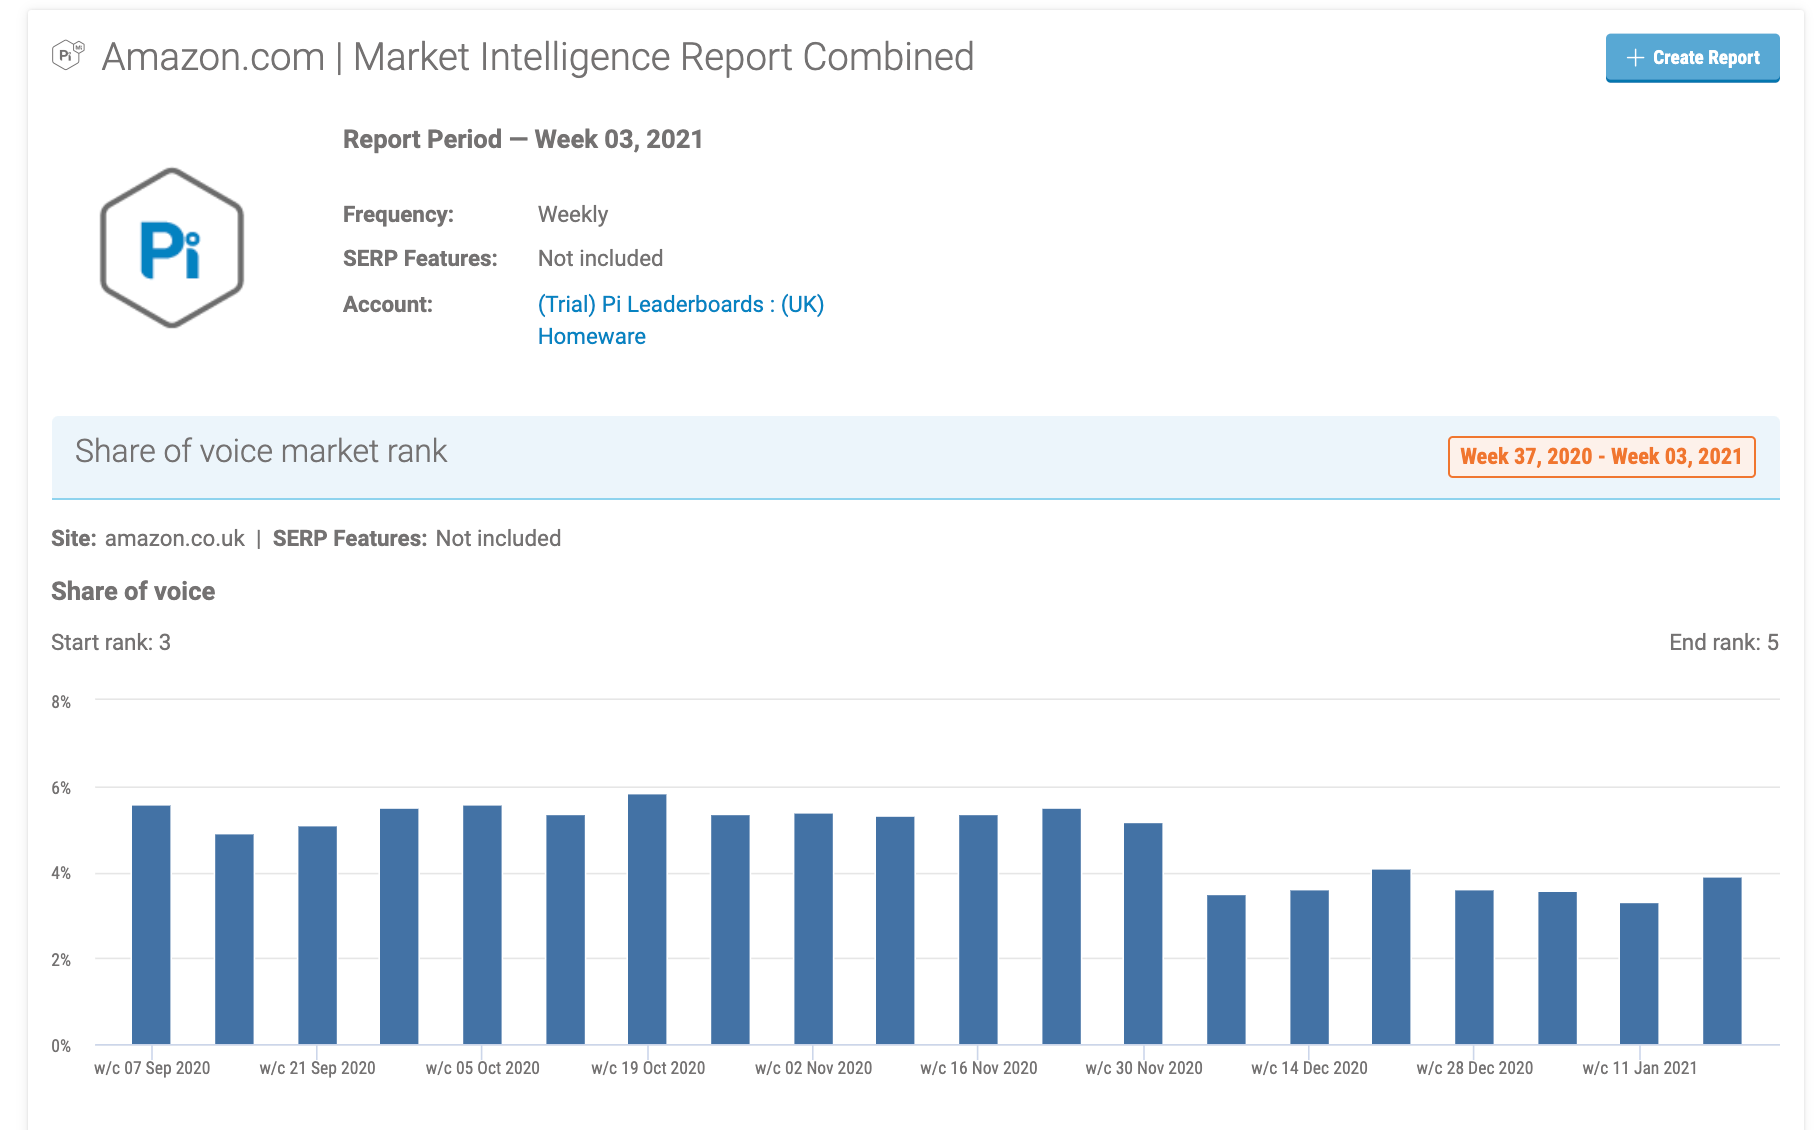
Within any previously created Market Intelligence report, you’ll see a link to ‘create report’ in the top right hand corner. Simply click on that and you can and then you’re straight into the components with all of your MI components pre-added.
You can then remove, add and move components around until you’re satisfied with the report. After this, click next and the report is ready.
Next step actions
Using Pi’s Keyword Rank Tracking Tool, you can go from Position Explorer Table to Position Explorer Chart is one of the most popular journeys within the PI platform. It’s a journey that provides a lot of useful insight from a single click.
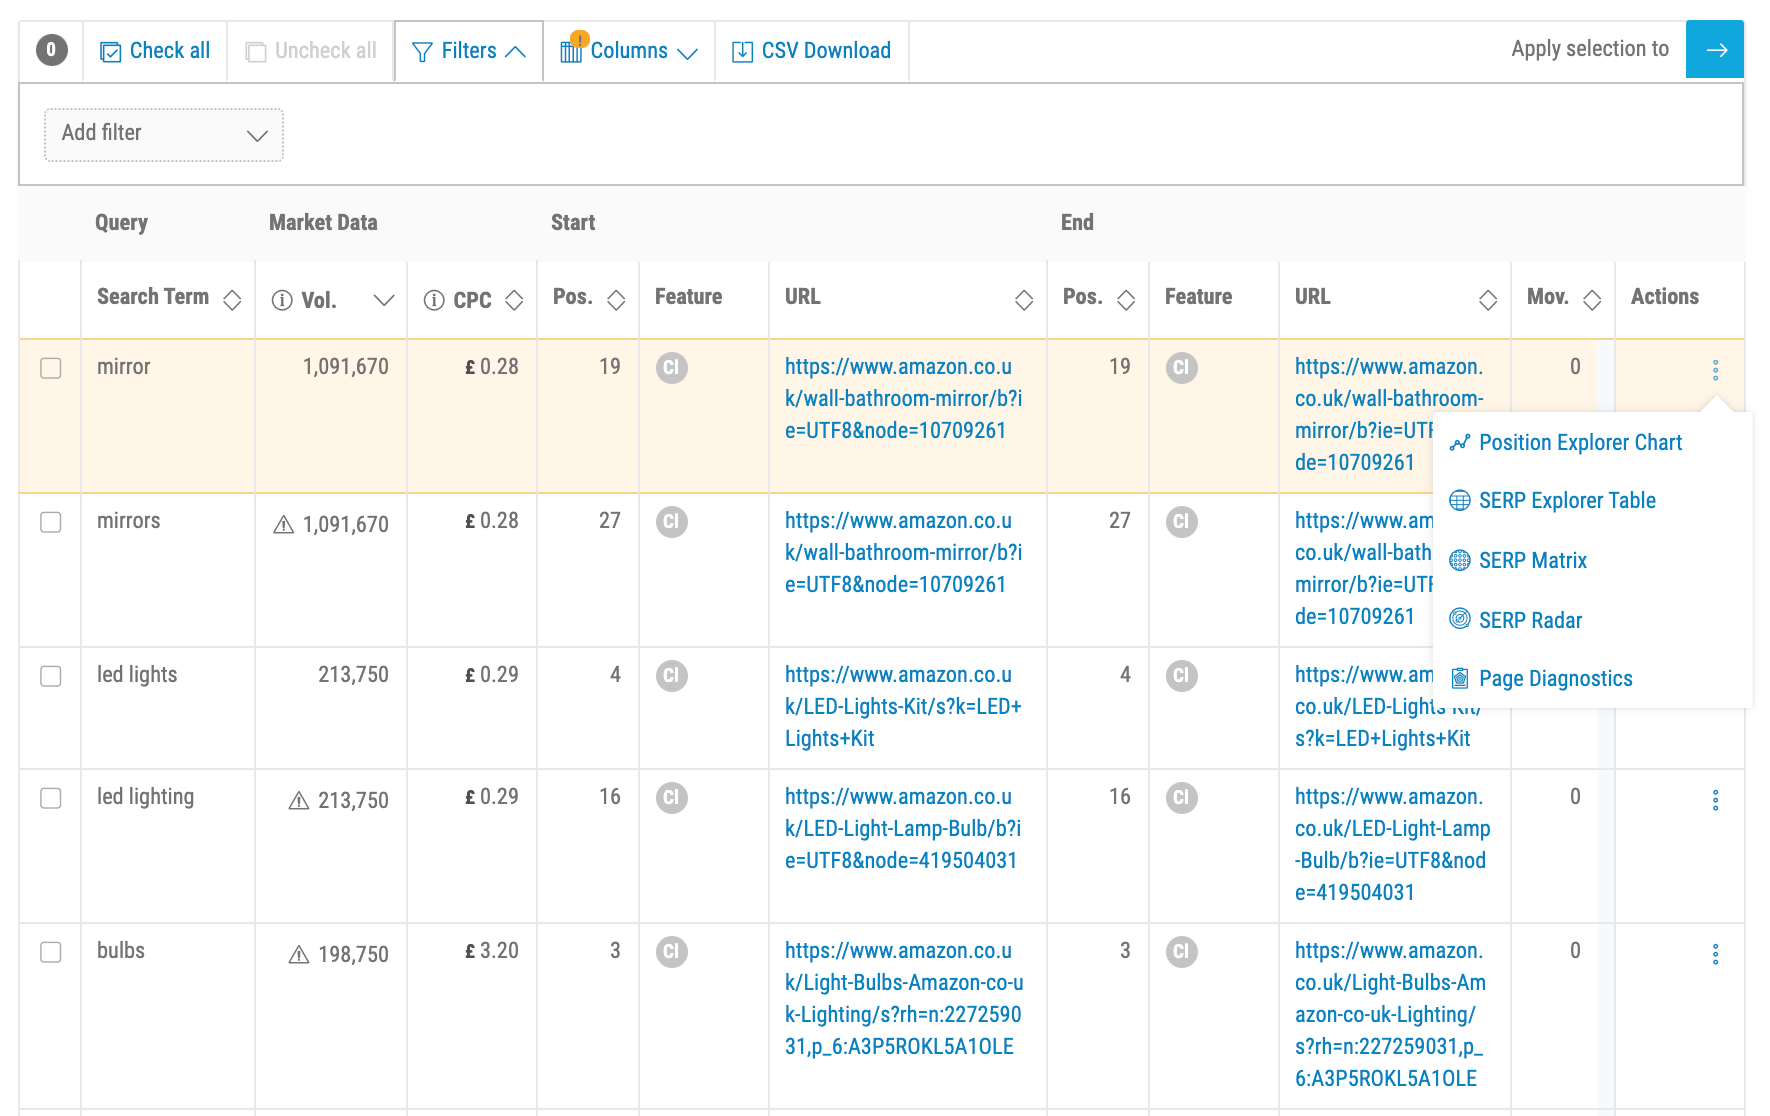
Users have asked us whether they could go from the Position Explorer table to SERP Explorer Table, or from there to SERP Radar, and we’ve now added these features.
Within the Position Explorer Chart, there is a new ‘actions’ column. In addition to the option to go to the chart view and page diagnostics which were there previously, we can now go straight to SERP Matrix and SERP Radar.
So we can look at the SERP radar, which produces a view for the single URL selected. This view enables us to see opportunities to improve ranking.
For example, we can see where there are opportunities to improve image search results, or rank for video cards.
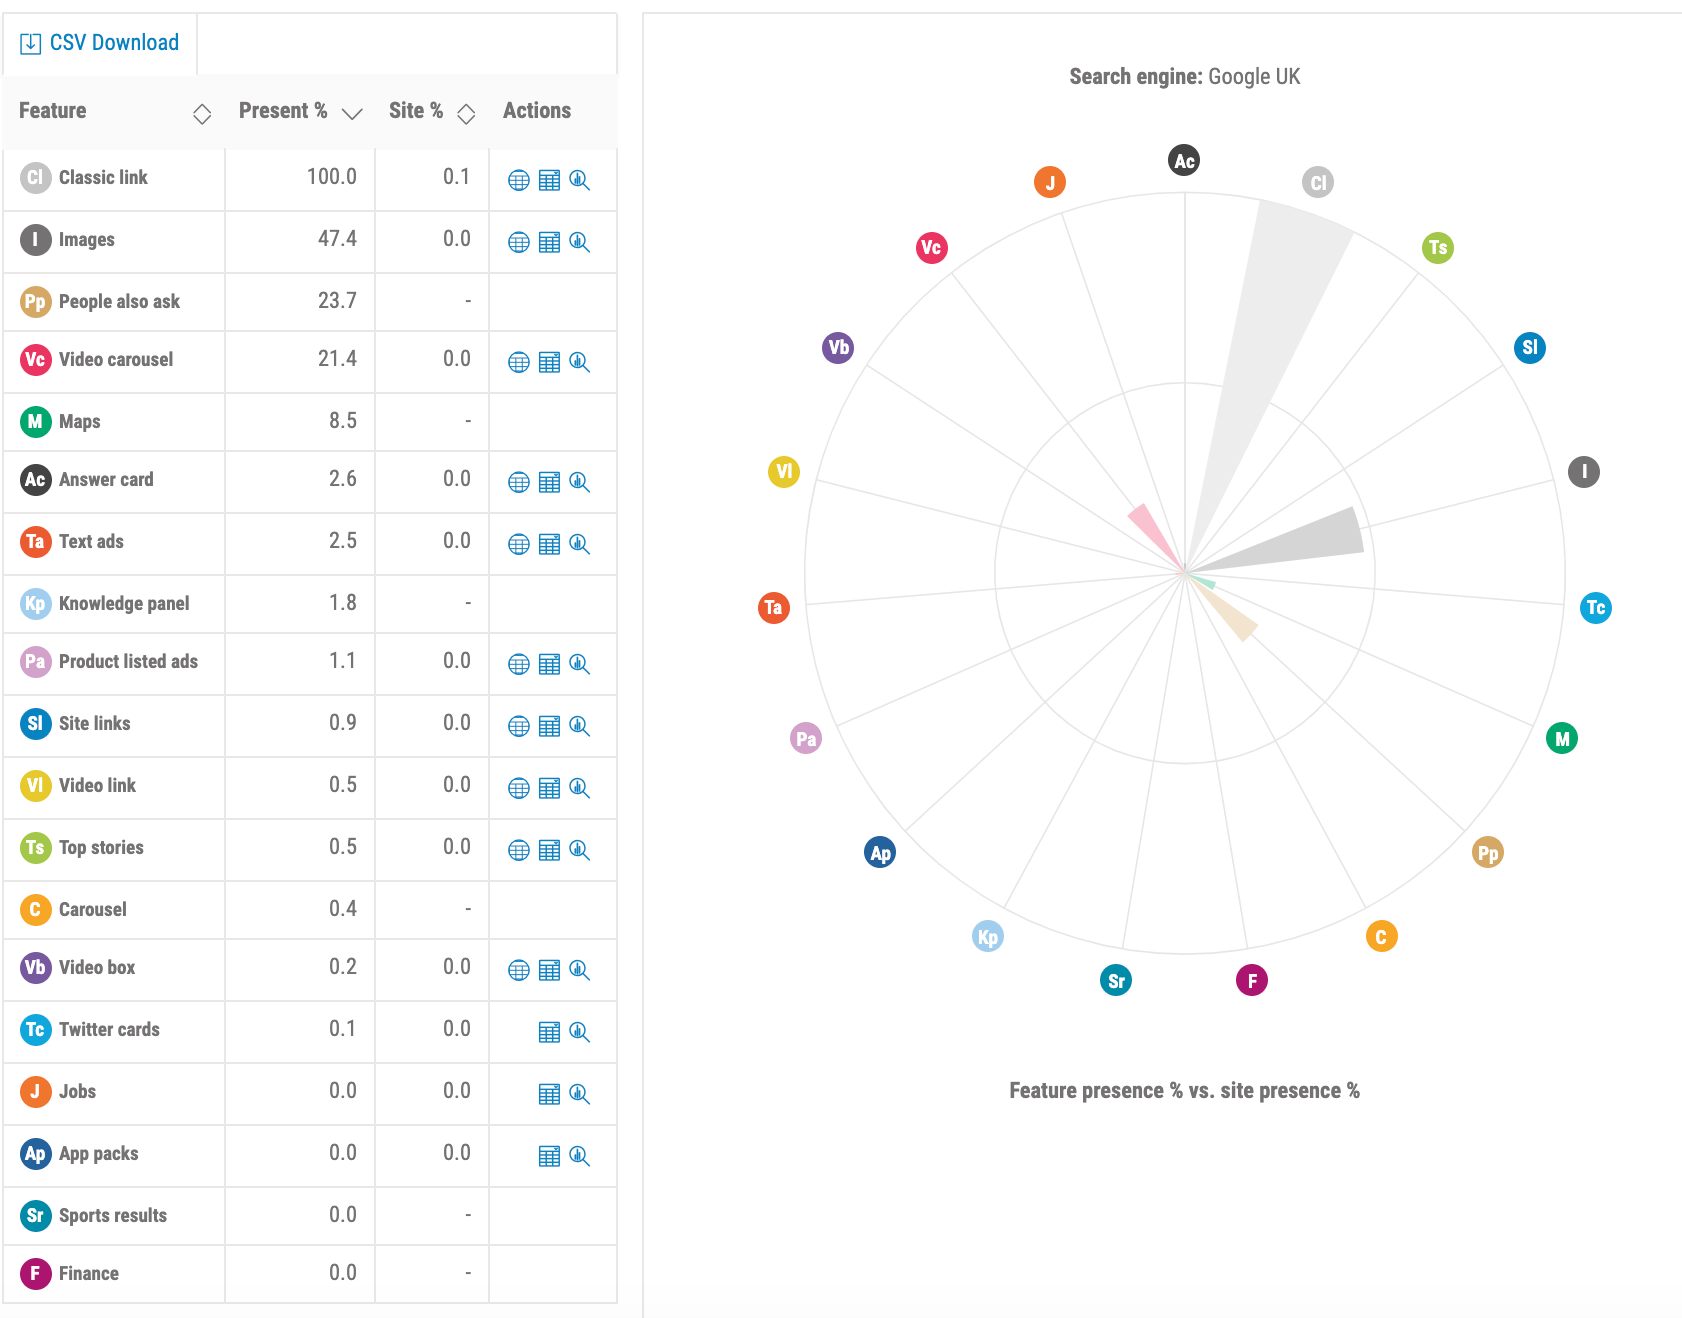
From this radar view we can jump straight into SERP Explorer Table, Position Explorer table or competitor discovery.
For example, by jumping into the Position Explorer table we can see which pieces of content are returning image results, and which other ranking opportunities are available to you.
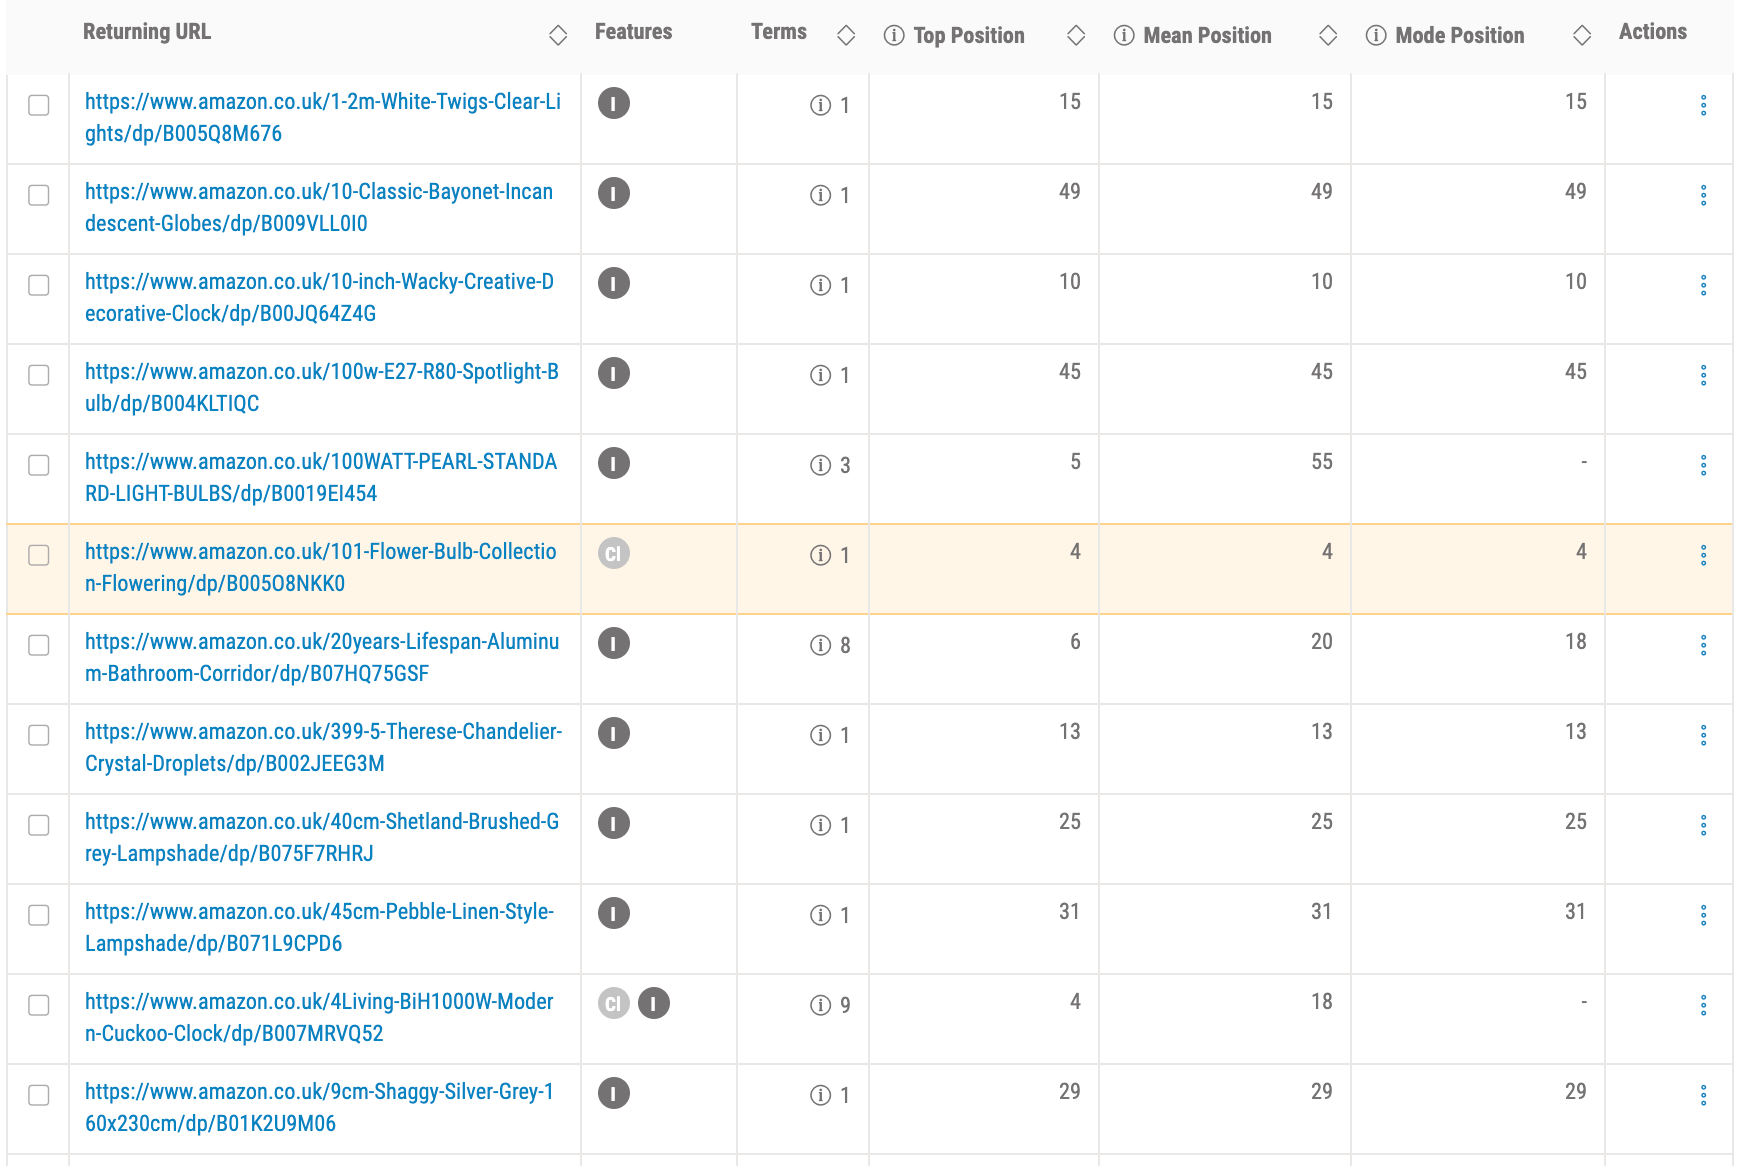
You can see which pieces of content have image results but no classic links, or vice versa, potentially opening up new opportunities to rank, or to find pages to optimise.
SERP feature reporting components
We know how increasingly important SERP features are, and how it’s key to keep on top of performance for features.
To do this, it’s important to stay on top of which features you’ve won and lost. This can sometimes be difficult to find.
So we’ve added a new feature which shows your movement and degree of presence for each feature type.
Below this we can the features gained, and the search term associates with each, along with key data like search volume. On the right, we can see losses. This allows you to look into optimisation to regain these positions.
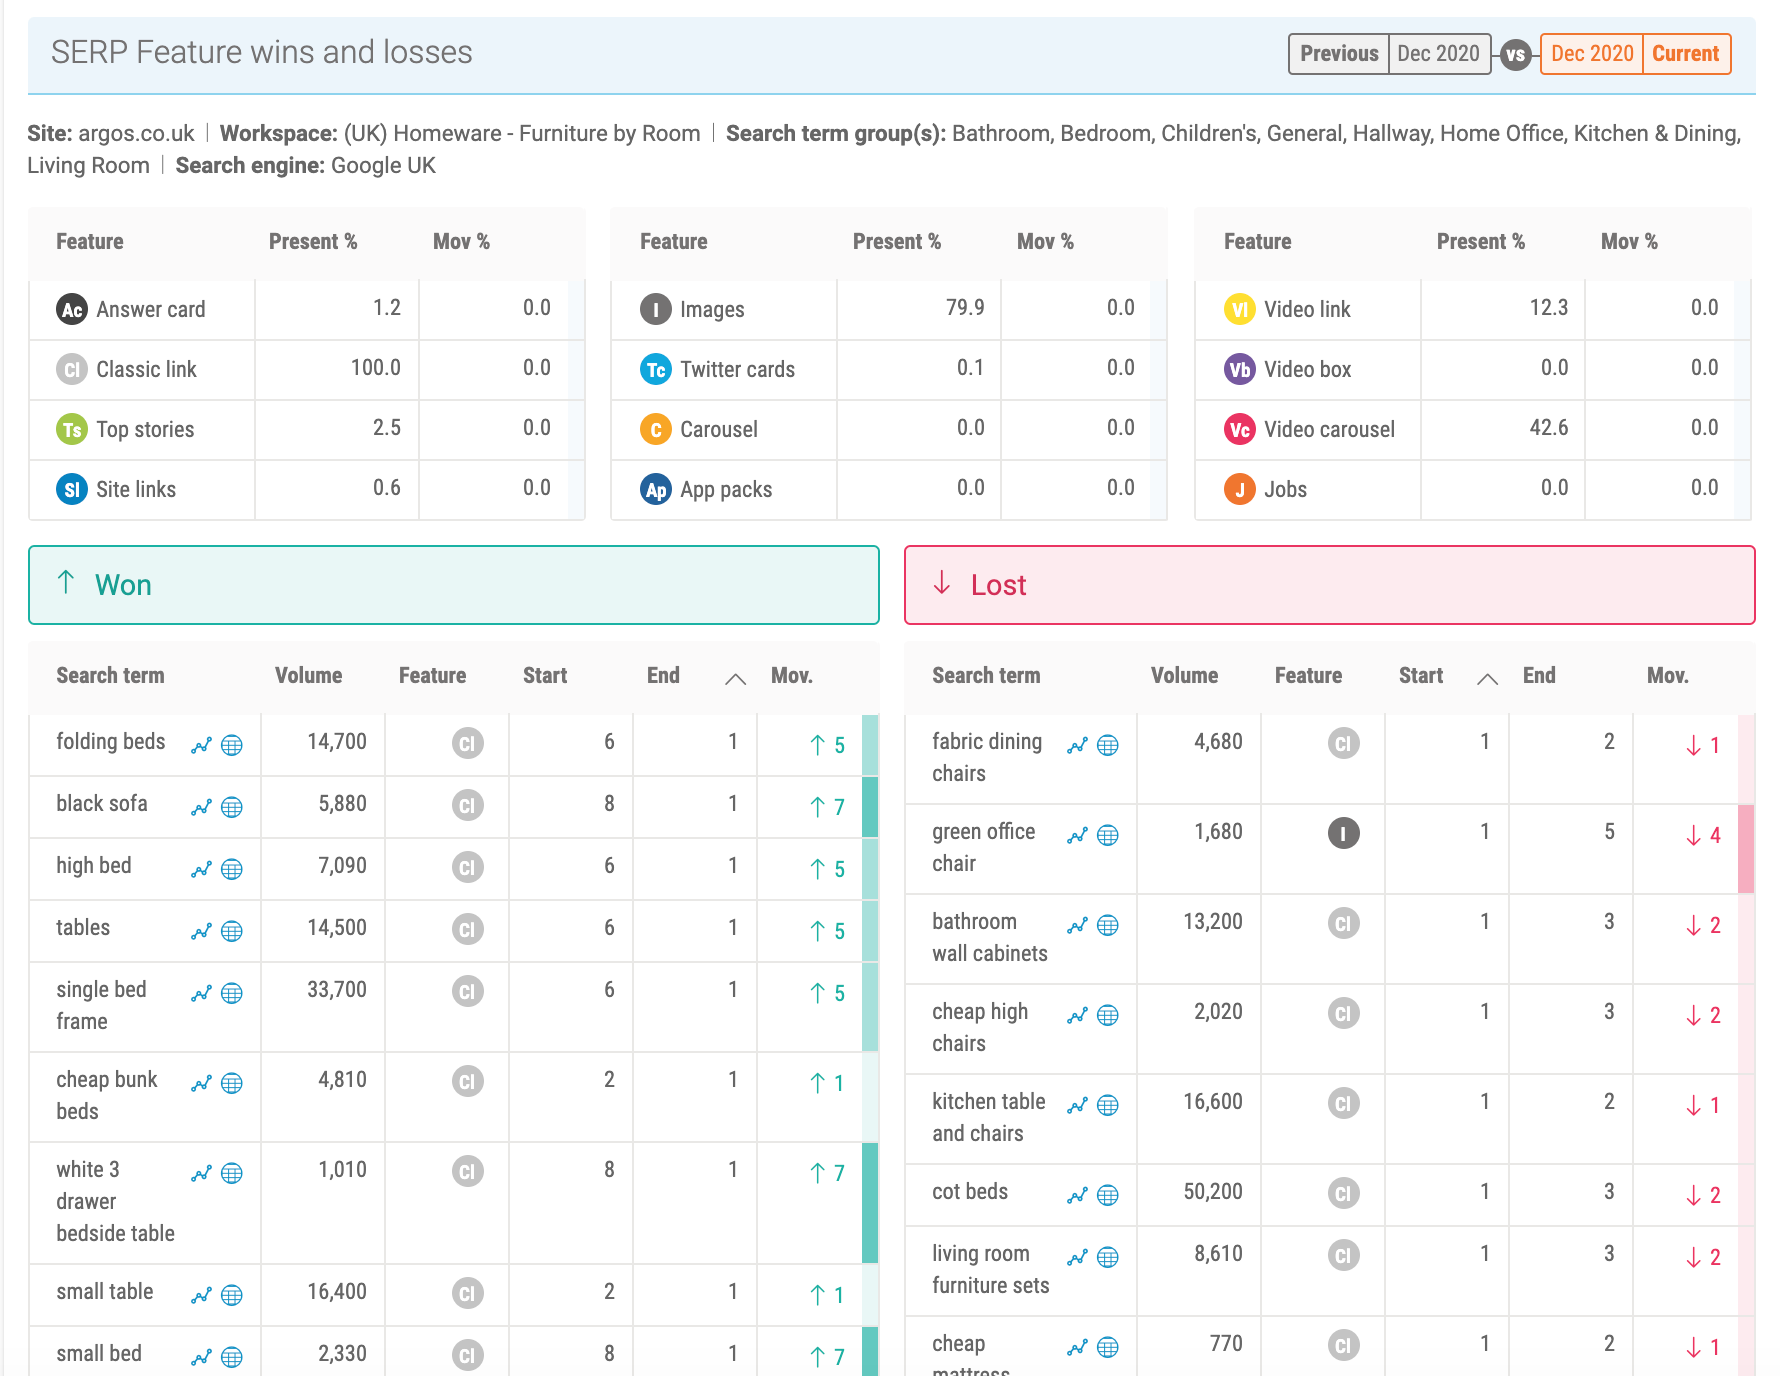
Another interesting aspect to look for is what happens when you gain one search feature but end up losing another. In the example above, this site has gained an answer card result for ‘toothache pain relief’ but the equivalent text link has dropped down.
We can therefore conclude that this is Google making classic links invisible as it doesn’t now show an answer card and text link from the same site.
This can be added when configuring a report, it’s simply another module to add in when creating a report. You can select which SERP features to view – just one or two that you are currently focusing on, or all of them.


Never miss a post
Join our mailing list and have our SEO news delivered straight to your inbox.