Electrical Leaderboard US
Who dominated in Google US for Electrical retail in Q1 2025?
Methodology
- Search Engine: Google US
- Categories: Computing | Home appliances | Small appliances | Smart tech & phones | Sound & vision
- Search Terms: 12,011 of the most commercially valuable terms
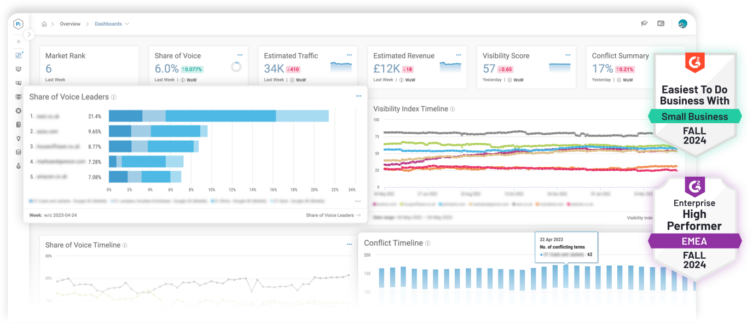
Experience our comprehensive suite of value-led insights and SEO tools
Book a demo to see the platform in action